
Exponential Growth—U.S. Population and World Population
Mathematical Modeling Exercise 1
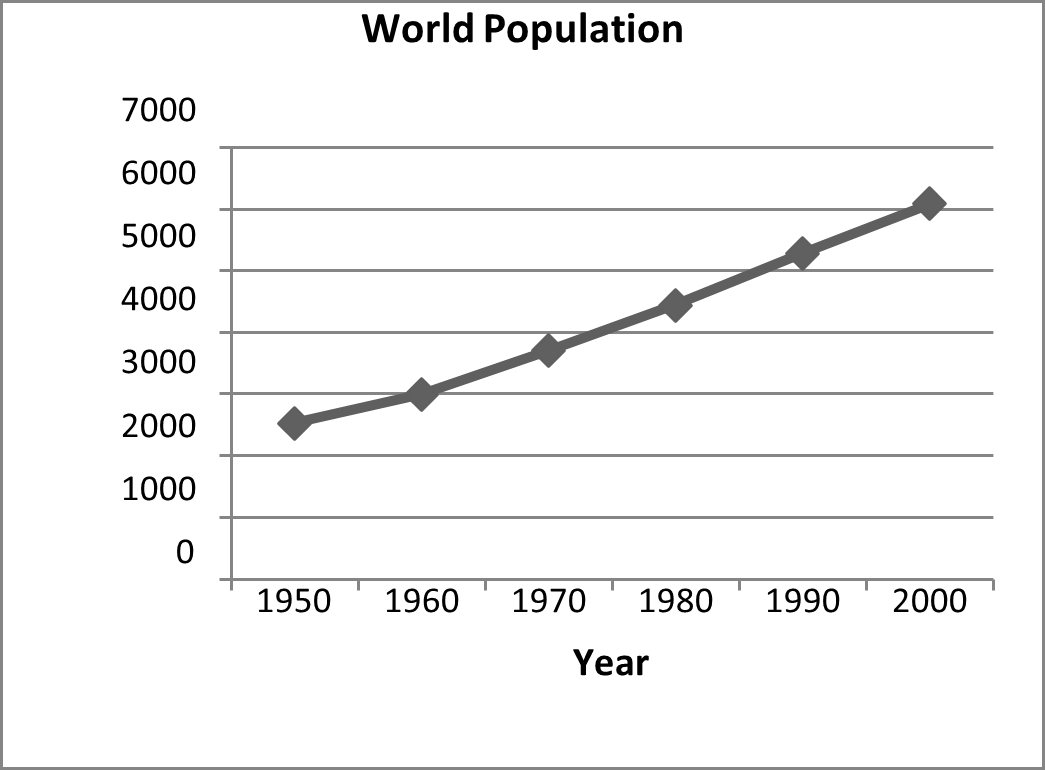
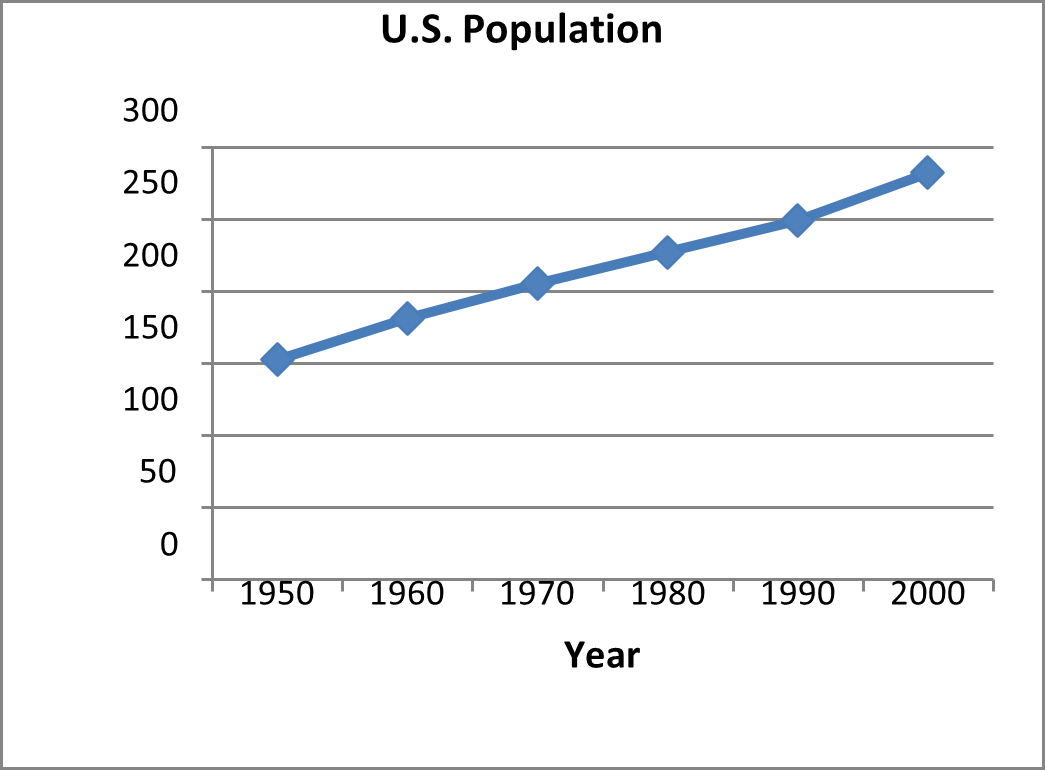
Callie and Joe are examining the population data in the graphs below for a history report. Their comments are as follows:
Callie: It looks like the U.S. population grew the same amount as the world population, but that can’t be right, can it? Joe: Well, I don’t think they grew by the same amount, but they sure grew at about the same rate. Look at the slopes.
1a. Is Callie’s observation correct? Why or why not?
1b. Is Joe’s observation correct? Why or why not?
2a. Show your work.
Use the World Population graph to estimate the percent increase in world population from 1950 to 2000.
Now, use the U.S. Population graph to estimate the percent increase in the U.S. population for the same time period
3a. How does the percent increase for the world population compare to that for the U.S. population over the same time period, 1950 to 2000?
3b. Do the graphs above seem to indicate linear or exponential population growth? Explain your response.
- Write an explicit formula for the function that models the world population growth from 1950
to 2000 based on the information in the graph. Assume that the population (in millions) in 1950
was 2,500 and in 2000 was 6,000. Use 𝑡 to represent the number of years after 1950.
Mathematical Modeling Exercise 2
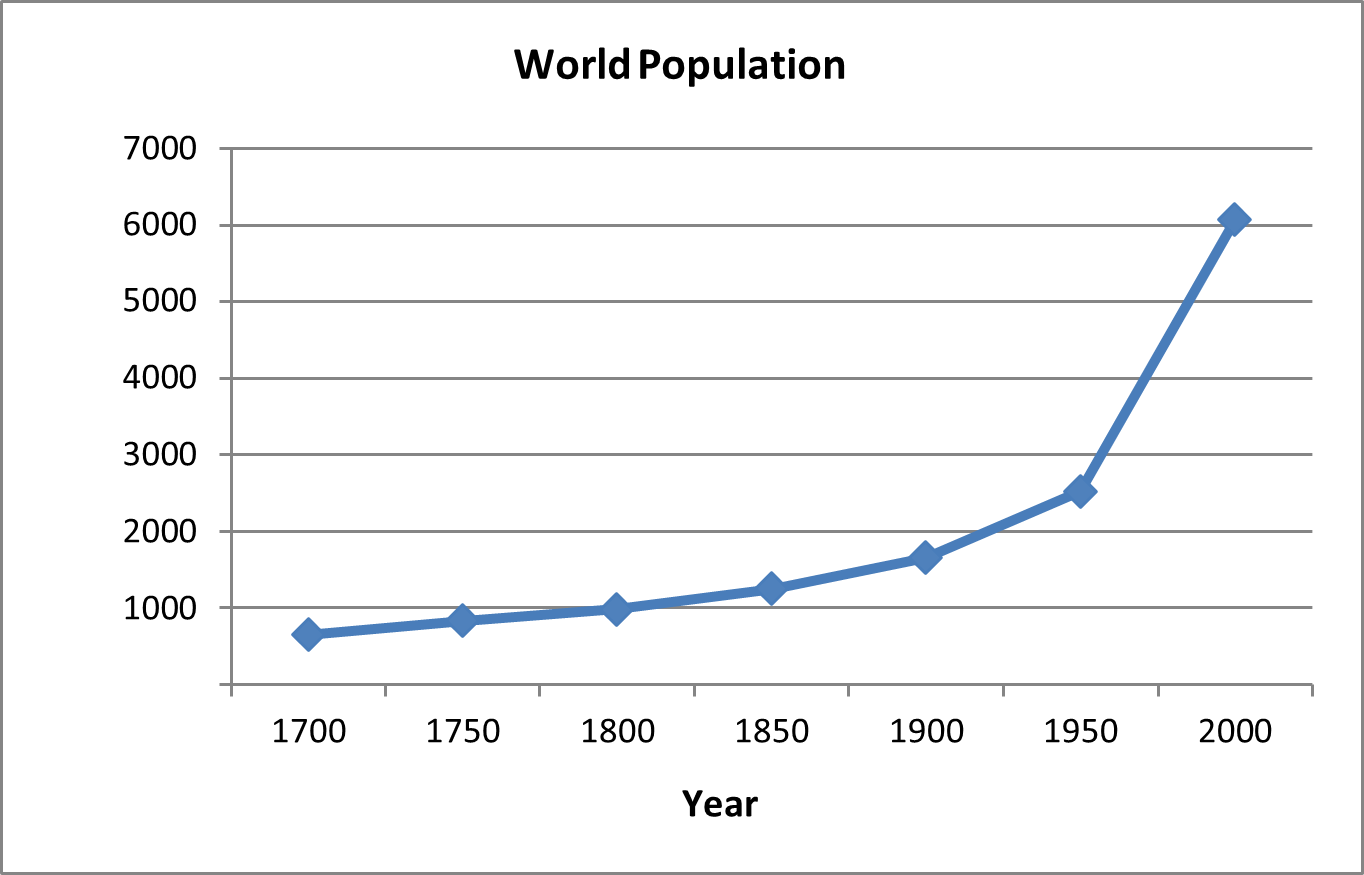
- How is this graph similar to the World Population graph in Mathematical Modeling Exercise 1? How is it different?
6a. Does the behavior of the graph from 1950 to 2000 match that shown on the graph in Mathematical Modeling Exercise 1? Explain your answer.
6b. Why is the graph from Mathematical Modeling Exercise 1 somewhat misleading?

Exponential Growth—U.S. Population and World Population
Mathematical Modeling Exercise 1
Callie and Joe are examining the population data in the graphs below for a history report. Their comments are as follows:
Callie: It looks like the U.S. population grew the same amount as the world population, but that can’t be right, can it? Joe: Well, I don’t think they grew by the same amount, but they sure grew at about the same rate. Look at the slopes.
1a. Is Callie’s observation correct? Why or why not?
1b. Is Joe’s observation correct? Why or why not?
2a. Show your work.
Use the World Population graph to estimate the percent increase in world population from 1950 to 2000.
Now, use the U.S. Population graph to estimate the percent increase in the U.S. population for the same time period
3a. How does the percent increase for the world population compare to that for the U.S. population over the same time period, 1950 to 2000?
3b. Do the graphs above seem to indicate linear or exponential population growth? Explain your response.
- Write an explicit formula for the function that models the world population growth from 1950
to 2000 based on the information in the graph. Assume that the population (in millions) in 1950
was 2,500 and in 2000 was 6,000. Use 𝑡 to represent the number of years after 1950.
Mathematical Modeling Exercise 2
- How is this graph similar to the World Population graph in Mathematical Modeling Exercise 1? How is it different?
6a. Does the behavior of the graph from 1950 to 2000 match that shown on the graph in Mathematical Modeling Exercise 1? Explain your answer.
6b. Why is the graph from Mathematical Modeling Exercise 1 somewhat misleading?
The post U.S. Population and World Population appeared first on Nursing Depo.